Dataファイル
JekyllのDataファイルは、YAML、JSON、CSVファイルによって読みやすくなります。データベースからデータを読むように扱えます。
今回、サイトでDataファイルを使おうと思っているのは、オフィスの場所を示したマップ付きのコンタクトページを追加する時です。
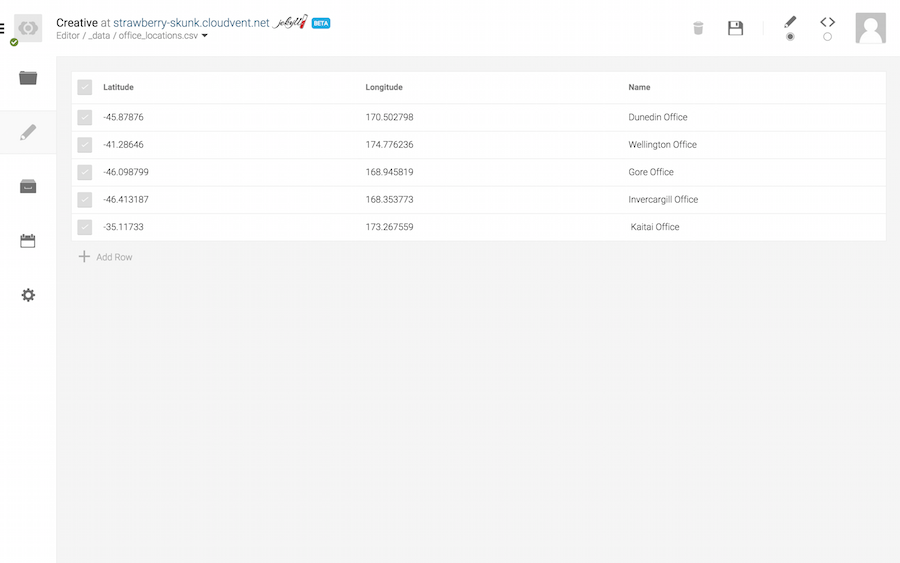
まず、オフィスの緯度と経度が書かれたCSVファイルが必要です。_data/office_locations.csv を以下の内容で作成してください:
latitude,longitude,name
-45.878760,170.502798,Dunedin Office
-41.286460,174.776236,Wellington Office
-46.098799,168.945819,Gore Office
-46.413187,168.353773,Invercargill Office
-35.117330, 173.267559,Kaitai Office次にcontact.htmlにマップとマーカーを追加します。site.data.office_locationsを使うことでCSV内のデータにアクセスできます。
GoogleマップはJavascript APIがあるので、Javascriptの変数にこれらのデータを使用します。 JSONフォーマットの出力は、実はJekyllではとても簡単です。
...
<script>
  var markers = [
    {% for location in site.data.office_locations %}
      ['{{ location.name }}', {{ location.latitude }}, {{ location.longitude }}]
      {% unless forloop.last %},{% endunless %}
    {% endfor %}
  ];
</script>
...現在のindexやlength、最初の項目か最後の項目か、などを知るために、forループ内でforloop変数が使えます。
ここでは、最後の項目_でない_かを確認し、コンマを追加しています。
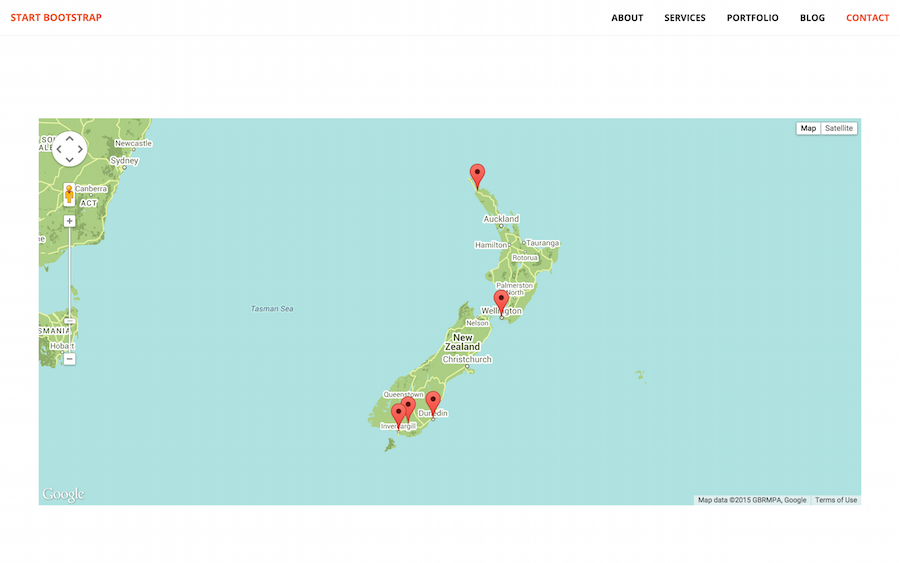
最後に、マップにプレースホルダーを追加したいので、マップを初期化し、マーカーを追加します。 このコードについて詳細には言及しません。しかし、SnazzyMapsを使ってかっこいいデザインをマップに施していることには触れておきますね。
これが最終的なコンタクトページです:
---
layout: default
title: Contact
---
<section class="bg-dark">
  <div class="text-center">
    <h1>Contact</h1>
  </div>
</section>

<section id="contact">
    <div class="container">
        <div class="row">
            <div class="col-lg-8 col-lg-offset-2 text-center">
                <h2 class="section-heading">Let's Get In Touch!</h2>
                <hr class="primary">
                <p>Ready to start your next project with us? That's great! Give us a call or send us an email and we will get back to you as soon as possible!</p>
            </div>
            <div class="col-lg-4 col-lg-offset-2 text-center">
                <i class="fa fa-phone fa-3x wow bounceIn"></i>
                <p>123-456-6789</p>
            </div>
            <div class="col-lg-4 text-center">
                <i class="fa fa-envelope-o fa-3x wow bounceIn" data-wow-delay=".1s"></i>
                <p><a href="mailto:your-email@your-domain.com">feedback@startbootstrap.com</a></p>
            </div>
        </div>
    </div>
</section>

<section>
    <div class="container">
        <div class="row">
            <div id="map_wrapper" style="height: 550px;">
                <div id="map_canvas" style="width:100%; height:100%"></div>
            </div>
        </div>
    </div>
</section>

<script src="https://maps.googleapis.com/maps/api/js?v=3.exp"></script>

<script>
    var markers = [
        {% for location in site.data.office_locations %}
            ['{{ location.name }}', {{ location.latitude }}, {{ location.longitude }}]
            {% unless forloop.last %},{% endunless %}
        {% endfor %}
    ];
</script>

<script>
    var map;

    function initialize() {
        var map;
        var bounds = new google.maps.LatLngBounds();
        var mapOptions = {
            mapTypeId: 'roadmap',
            styles: [{"featureType":"water","elementType":"geometry","stylers":[{"visibility":"on"},{"color":"#aee2e0"}]},{"featureType":"landscape","elementType":"geometry.fill","stylers":[{"color":"#abce83"}]},{"featureType":"poi","elementType":"geometry.fill","stylers":[{"color":"#769E72"}]},{"featureType":"poi","elementType":"labels.text.fill","stylers":[{"color":"#7B8758"}]},{"featureType":"poi","elementType":"labels.text.stroke","stylers":[{"color":"#EBF4A4"}]},{"featureType":"poi.park","elementType":"geometry","stylers":[{"visibility":"simplified"},{"color":"#8dab68"}]},{"featureType":"road","elementType":"geometry.fill","stylers":[{"visibility":"simplified"}]},{"featureType":"road","elementType":"labels.text.fill","stylers":[{"color":"#5B5B3F"}]},{"featureType":"road","elementType":"labels.text.stroke","stylers":[{"color":"#ABCE83"}]},{"featureType":"road","elementType":"labels.icon","stylers":[{"visibility":"off"}]},{"featureType":"road.local","elementType":"geometry","stylers":[{"color":"#A4C67D"}]},{"featureType":"road.arterial","elementType":"geometry","stylers":[{"color":"#9BBF72"}]},{"featureType":"road.highway","elementType":"geometry","stylers":[{"color":"#EBF4A4"}]},{"featureType":"transit","stylers":[{"visibility":"off"}]},{"featureType":"administrative","elementType":"geometry.stroke","stylers":[{"visibility":"on"},{"color":"#87ae79"}]},{"featureType":"administrative","elementType":"geometry.fill","stylers":[{"color":"#7f2200"},{"visibility":"off"}]},{"featureType":"administrative","elementType":"labels.text.stroke","stylers":[{"color":"#ffffff"},{"visibility":"on"},{"weight":4.1}]},{"featureType":"administrative","elementType":"labels.text.fill","stylers":[{"color":"#495421"}]},{"featureType":"administrative.neighborhood","elementType":"labels","stylers":[{"visibility":"off"}]}]

        };

        // Display a map on the page
        map = new google.maps.Map(document.getElementById("map_canvas"), mapOptions);
        map.setTilt(45);

        // Loop through our array of markers and place each one on the map
        for (var i = 0; i < markers.length; i++ ) {
            var position = new google.maps.LatLng(markers[i][1], markers[i][2]);
            bounds.extend(position);
            marker = new google.maps.Marker({
                position: position,
                map: map,
                title: markers[i][0]
            });

            // Automatically center the map fitting all markers on the screen
            map.fitBounds(bounds);
        }

        // Override our map zoom level once our fitBounds function runs (Make sure it only runs once)
        var boundsListener = google.maps.event.addListener((map), 'bounds_changed', function(event) {
            this.setZoom(5);
            google.maps.event.removeListener(boundsListener);
        });
    }

    google.maps.event.addDomListener(window, 'load', initialize);
</script>
これでオフィスの場所を表示する美しいマップを追加できました。
クライアントはCollectionsタブに移動し、General Dataを選ぶことで、簡単にオフィスの場所を更新できるインターフェースを使うことができます。